Schematics
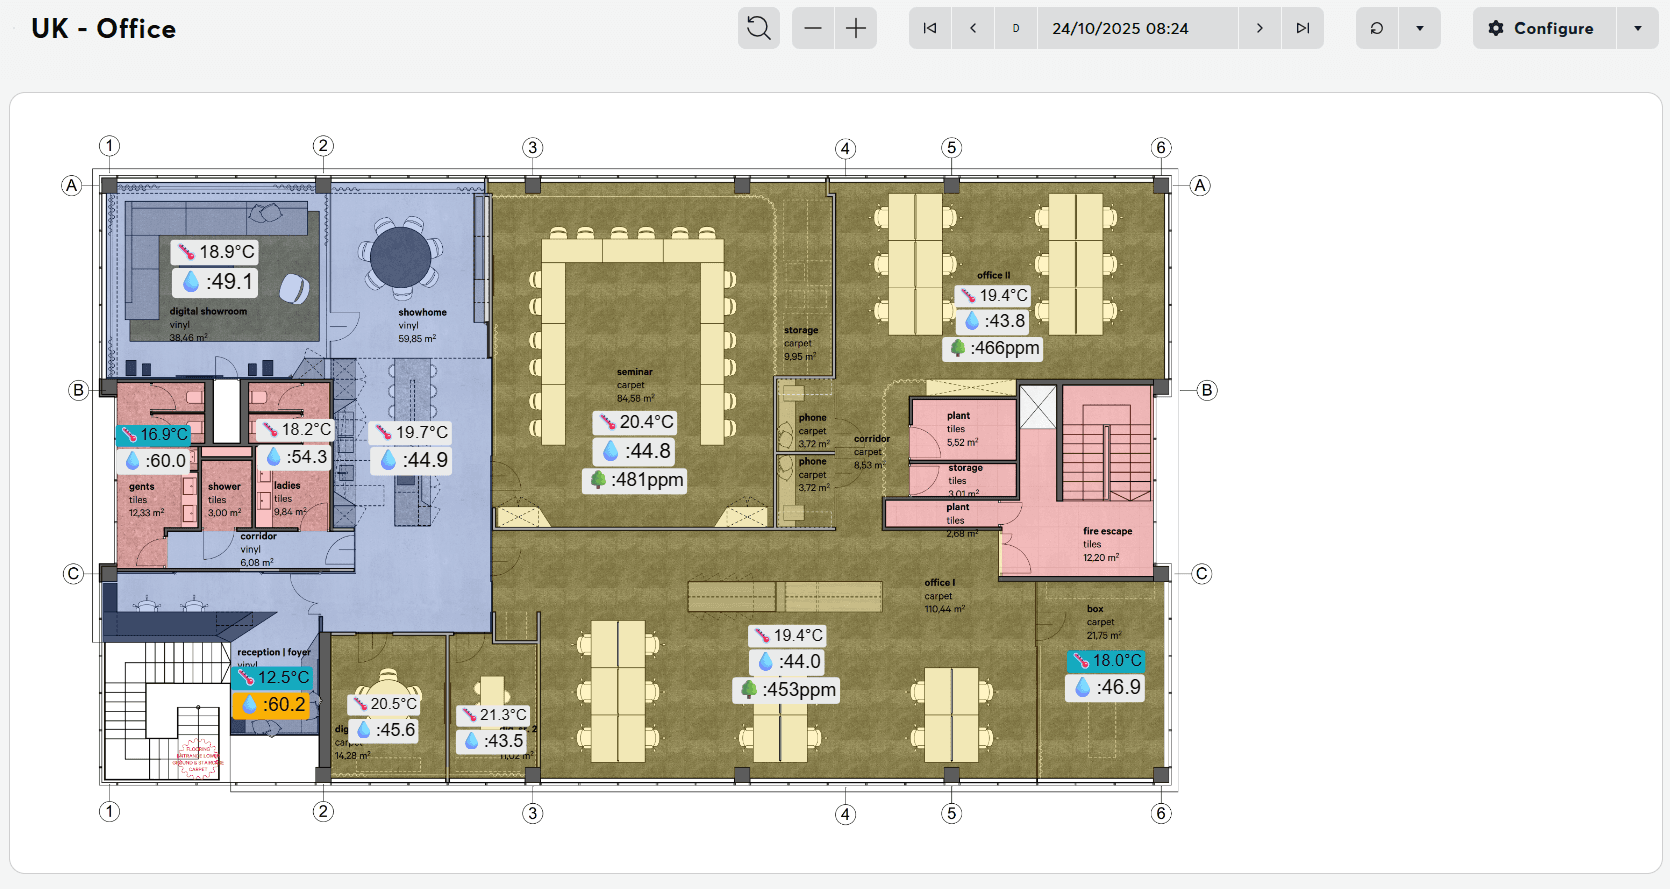
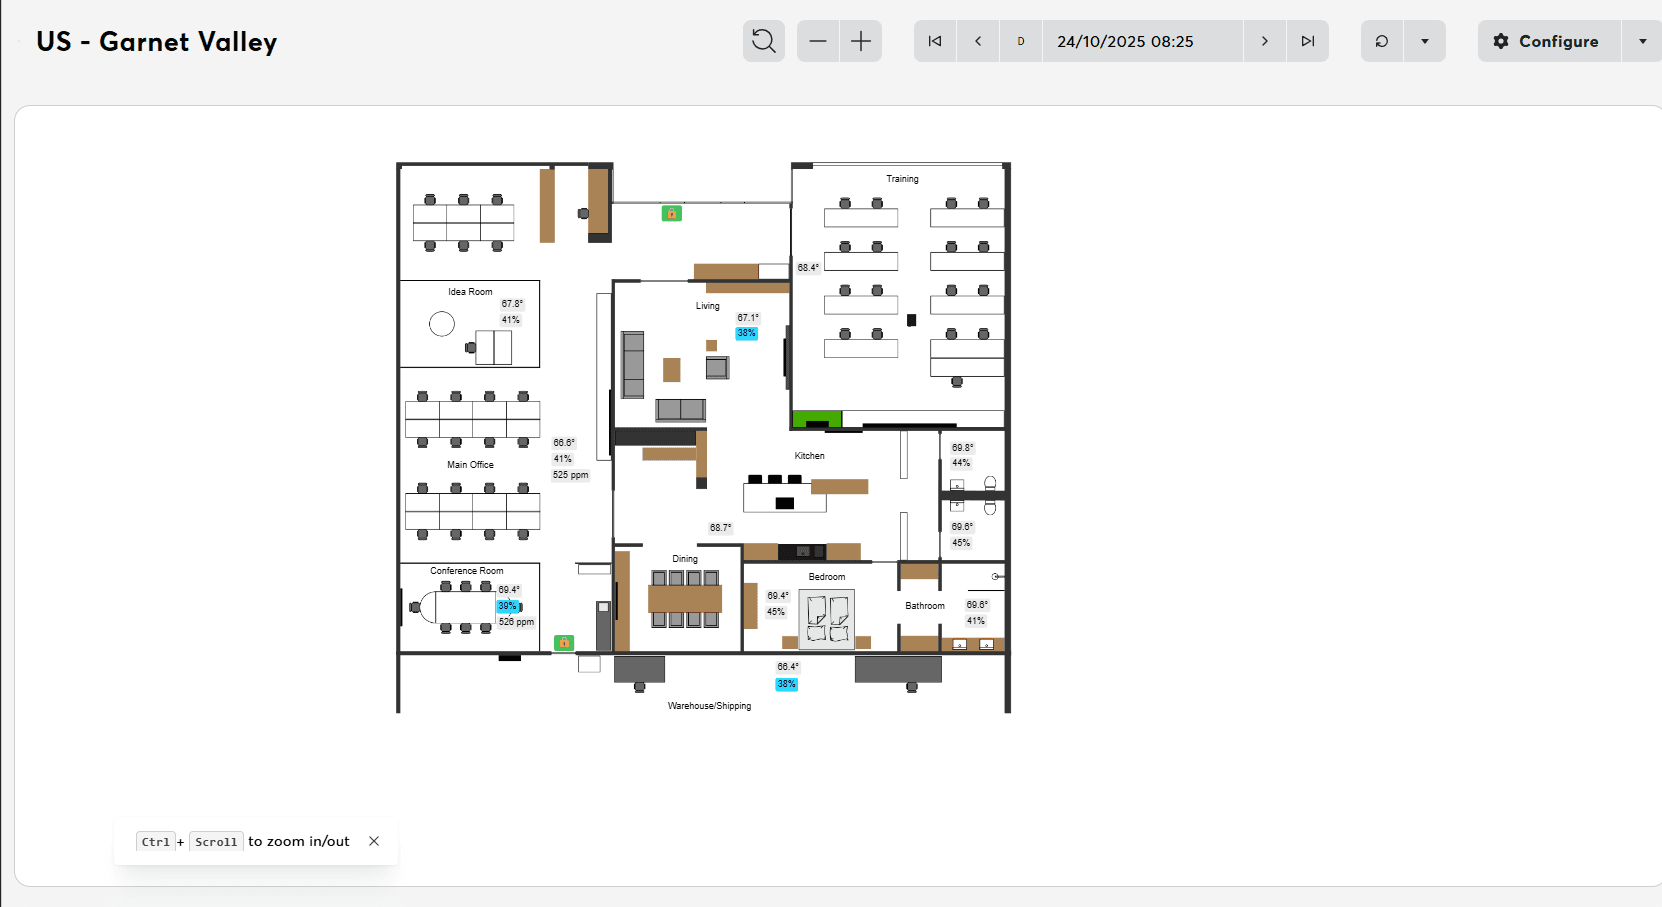
Visualize building layouts and floor plans with live control values overlaid on custom graphics
Creating a Schematic
1. Prepare Your Background Image
Start by creating or obtaining a suitable background image for your schematic:
- Recommended Format: SVG (vector graphics for perfect scaling)
- Maximum File Size: 10 MB
2. Navigate to Analytics
Go to your workspace, then navigate to Analytics → Schematics → "New Schematic".
3. Upload Background
- Click "Upload Background Image".
- Select your floor plan or diagram.
- Wait for the upload to complete.
- The image will display in the schematic editor.
4. Add Control Overlays
Click Add Data Point to add a control overlay to the schematic.
Click Add Label to add a static label to the schematic.
- Formatting: Customize:
- Font size and color
- Background color/opacity
5. Save and Test
- Click "Save".
- Exit edit mode.
- Test the schematic on different screen sizes.
Troubleshooting
For common schematic issues, see the Troubleshooting Guide.
Quick Fixes
- Control values not updating? Check device connection
- Background image not displaying? Re-upload (max 10 MB, SVG/PNG/JPG)
- Overlay not visible? Check positioning (may be off-screen)
- Slow performance? Reduce overlay count or optimize background image
Related Features
- Dashboards – Embed schematics in dashboard panels
- Charts – View historical data for schematic controls
- Value History – View measurement data in tabular format
Related Documentation
- Connection Troubleshooting – Device connectivity requirements
- Structure File Integration – Control metadata
- User Permissions – Role-based access control