Dashboards
Build custom layouts combining charts and schematics to create comprehensive monitoring views for your installations
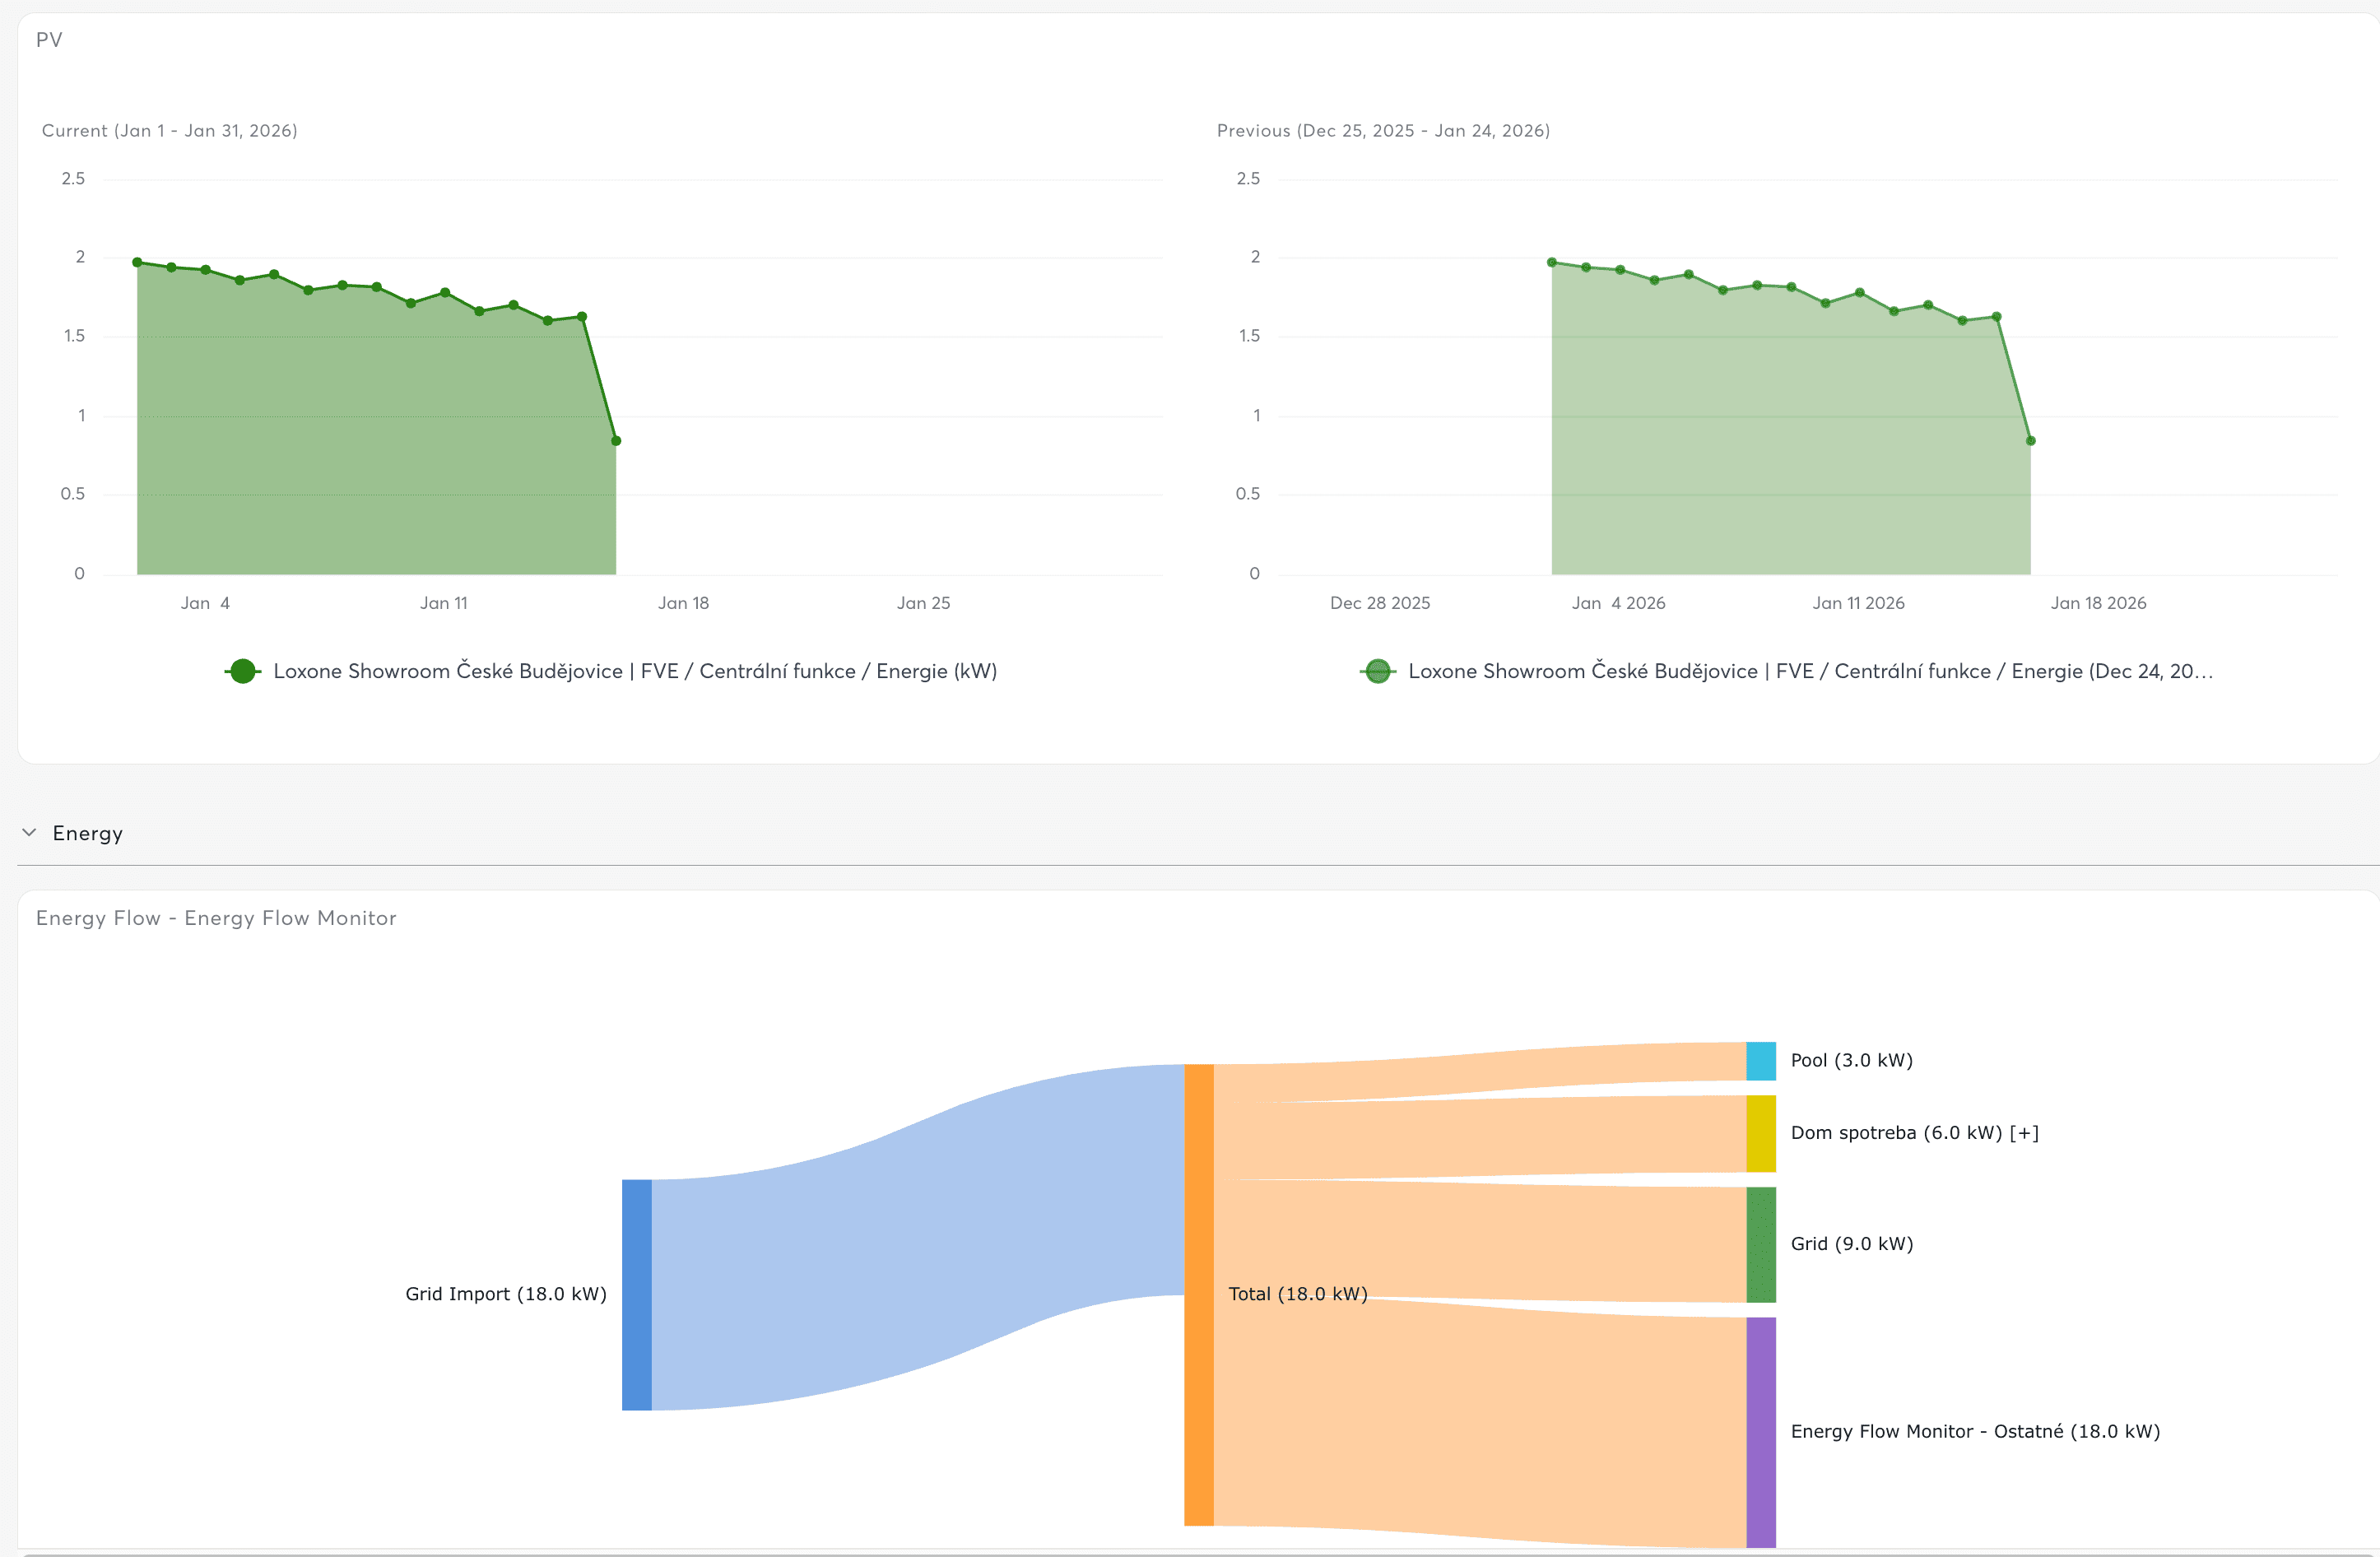
Dashboards combine multiple charts and schematics into a single, unified view. Create custom layouts for system monitoring, department-specific views, or customer-facing status displays.
Use Cases
- System Overview – Monitor all critical systems at a glance
- Department-specific Views – Tailored displays for different teams
- Customer-facing Displays – Status boards for lobbies or control rooms
- Multi-location Comparisons – Compare performance across sites
- Energy Monitoring – Track consumption and efficiency metrics
Dashboard Components
Panel Types
Dashboards contain two types of panels:
Chart Panels
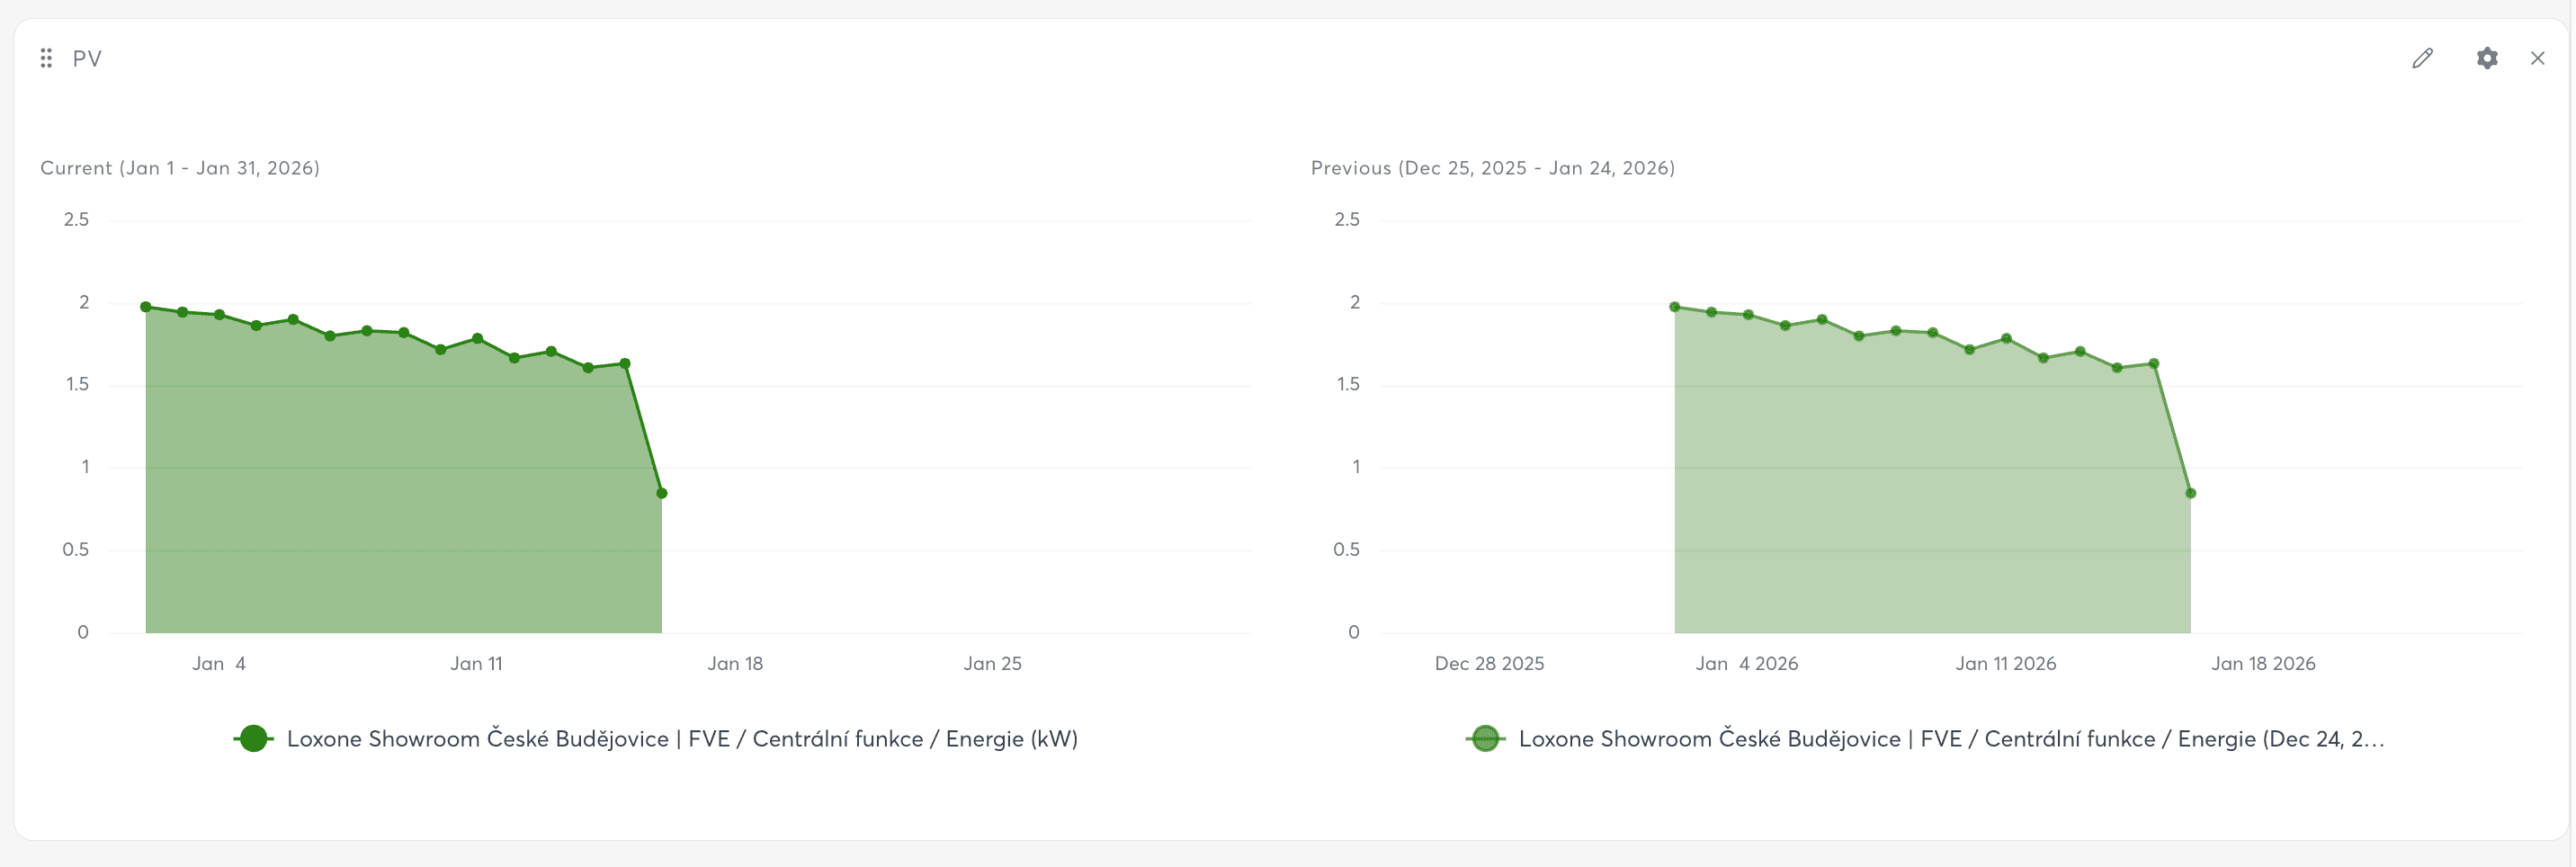
Embed any saved chart from your workspace.
- Display line charts, bar charts, gauges, and all other chart types
- Inherit dashboard-wide time range or use panel-specific settings
- Support real-time updates with auto-refresh
- Responsive sizing adapts to panel dimensions
Schematic Panels
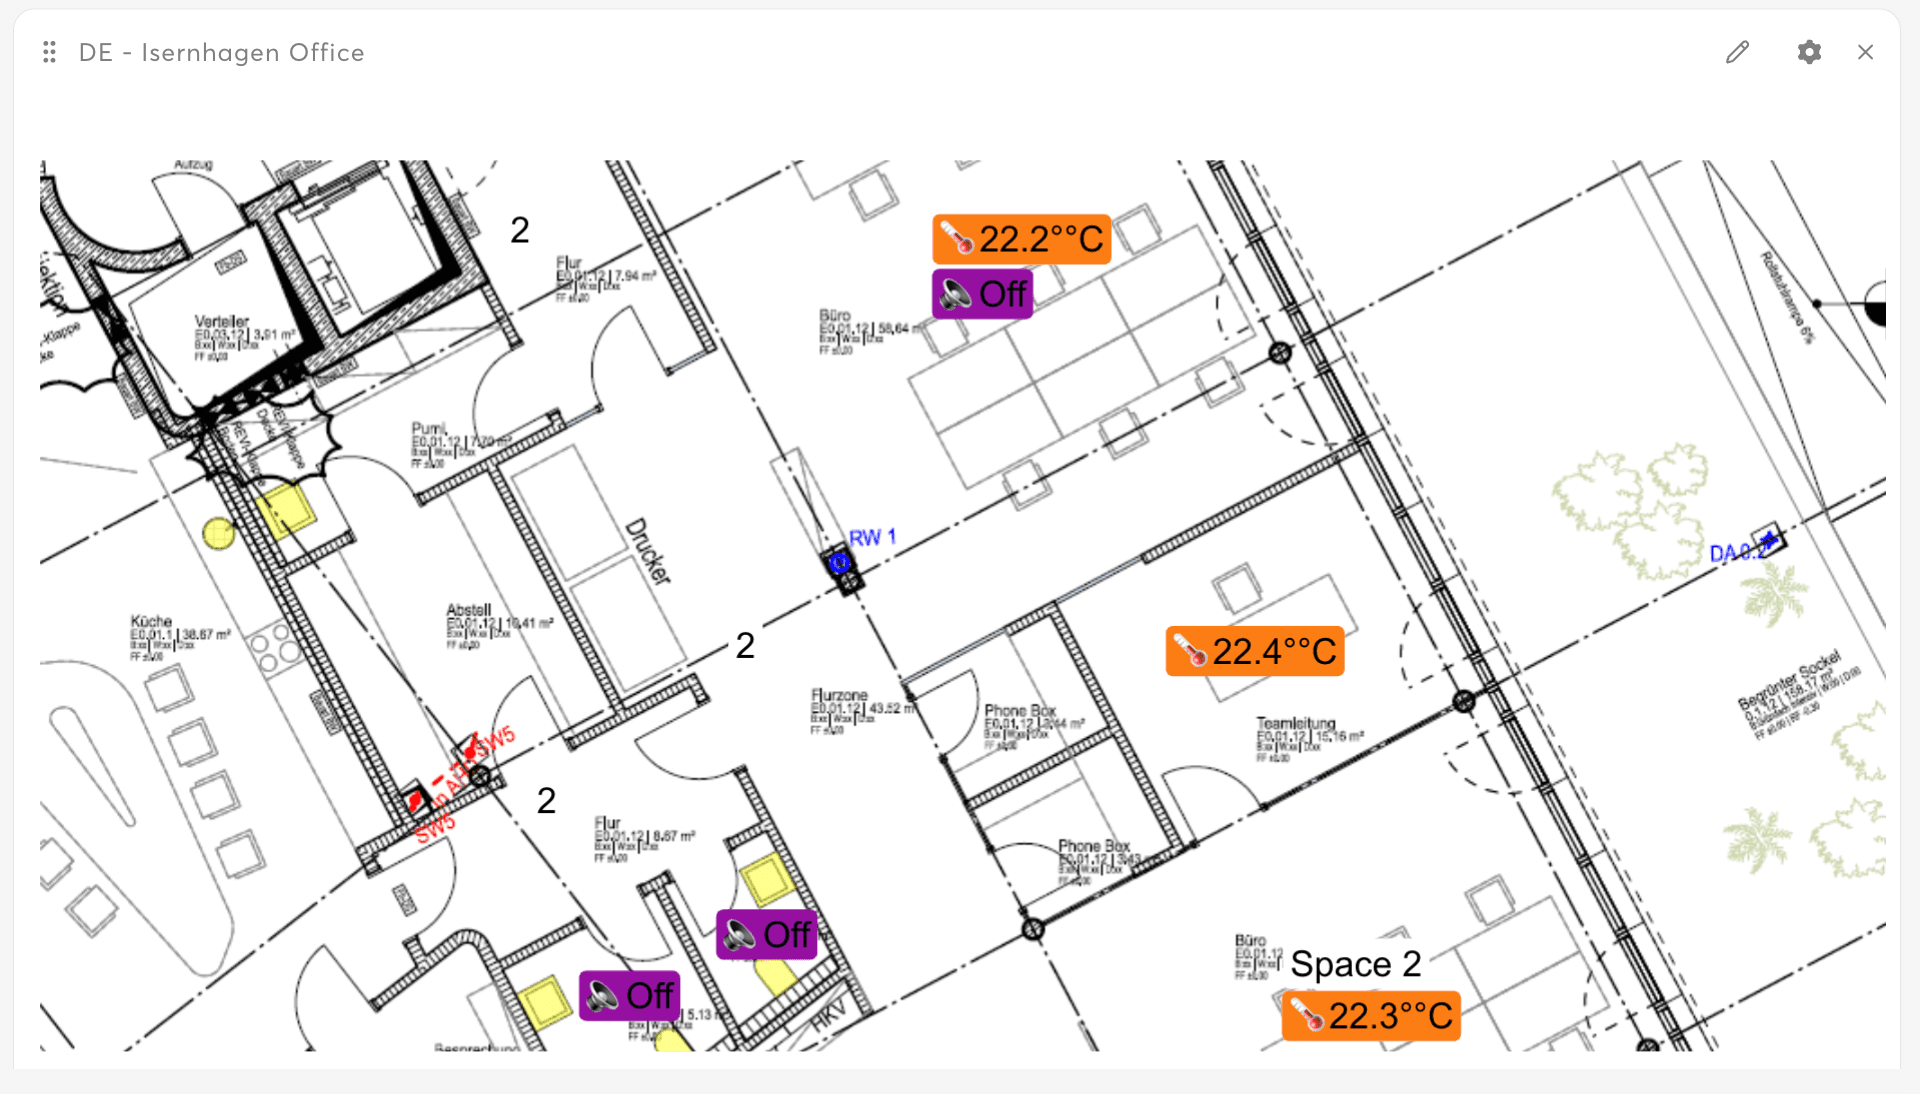
Embed interactive floor plans and system diagrams.
- Display building layouts with live sensor overlays
- Show real-time control values and states
- Support pan and zoom with position persistence
- Click through to full schematic view
Sections
Organize panels into logical groups using sections.
Regular Sections
Collapsible groups with custom titles:
- Collapsible – Click to expand/collapse
- Editable title – Name sections by area, system, or purpose
- Remove section – Delete section without deleting panels
Dynamic Sections
Dynamic sections that auto-generate panels from a chart:
- One panel per sensor – Automatically creates individual panels for each series in a chart
- Pagination – Handles large numbers of sensors (50+ per page)
- Linked to source chart – Click to edit the underlying chart
- Filters apply – Dashboard series filter affects displayed sensors
Use dynamic sections for "one chart per room" type dashboards where you want to show the same metric across many locations.

Creating a Dashboard
From Scratch
- Navigate to Analytics → Dashboards
- Click "New Dashboard"
- Enter a name for your dashboard
- Assign to a structure element (optional)
- Click Create
From Template
Exosphere provides pre-configured dashboard templates:
- Navigate to Analytics → Dashboards
- Browse the Template Browser at the top of the page
- Click a template card
- Click Create from Template
- Configure the template by selecting sensors for each panel

Available Templates
| Template | Panels Included | Best For |
|---|---|---|
| Energy Overview | Energy flow (Sankey), consumption at multiple granularities, top consumers | Comprehensive energy monitoring |
| Energy Usage | Consumption and load tracking | Daily energy analysis |
| Room Climate | Temperature monitoring | Building comfort monitoring |
| Building Performance | Energy and climate with EFM | Facility management |
| Load Analysis | Base load vs peak load | Electrical load optimization |
| Meter Reading | Consumption and top consumers | Utility tracking |
| Price Tracking | Energy prices with consumption | Cost analysis |
Editing Dashboards
Entering Edit Mode
- Click the "Configure" button in the dashboard toolbar
- Or use keyboard shortcut:
Cmd+E(Mac) /Ctrl+E(Windows)
Edit Mode Features
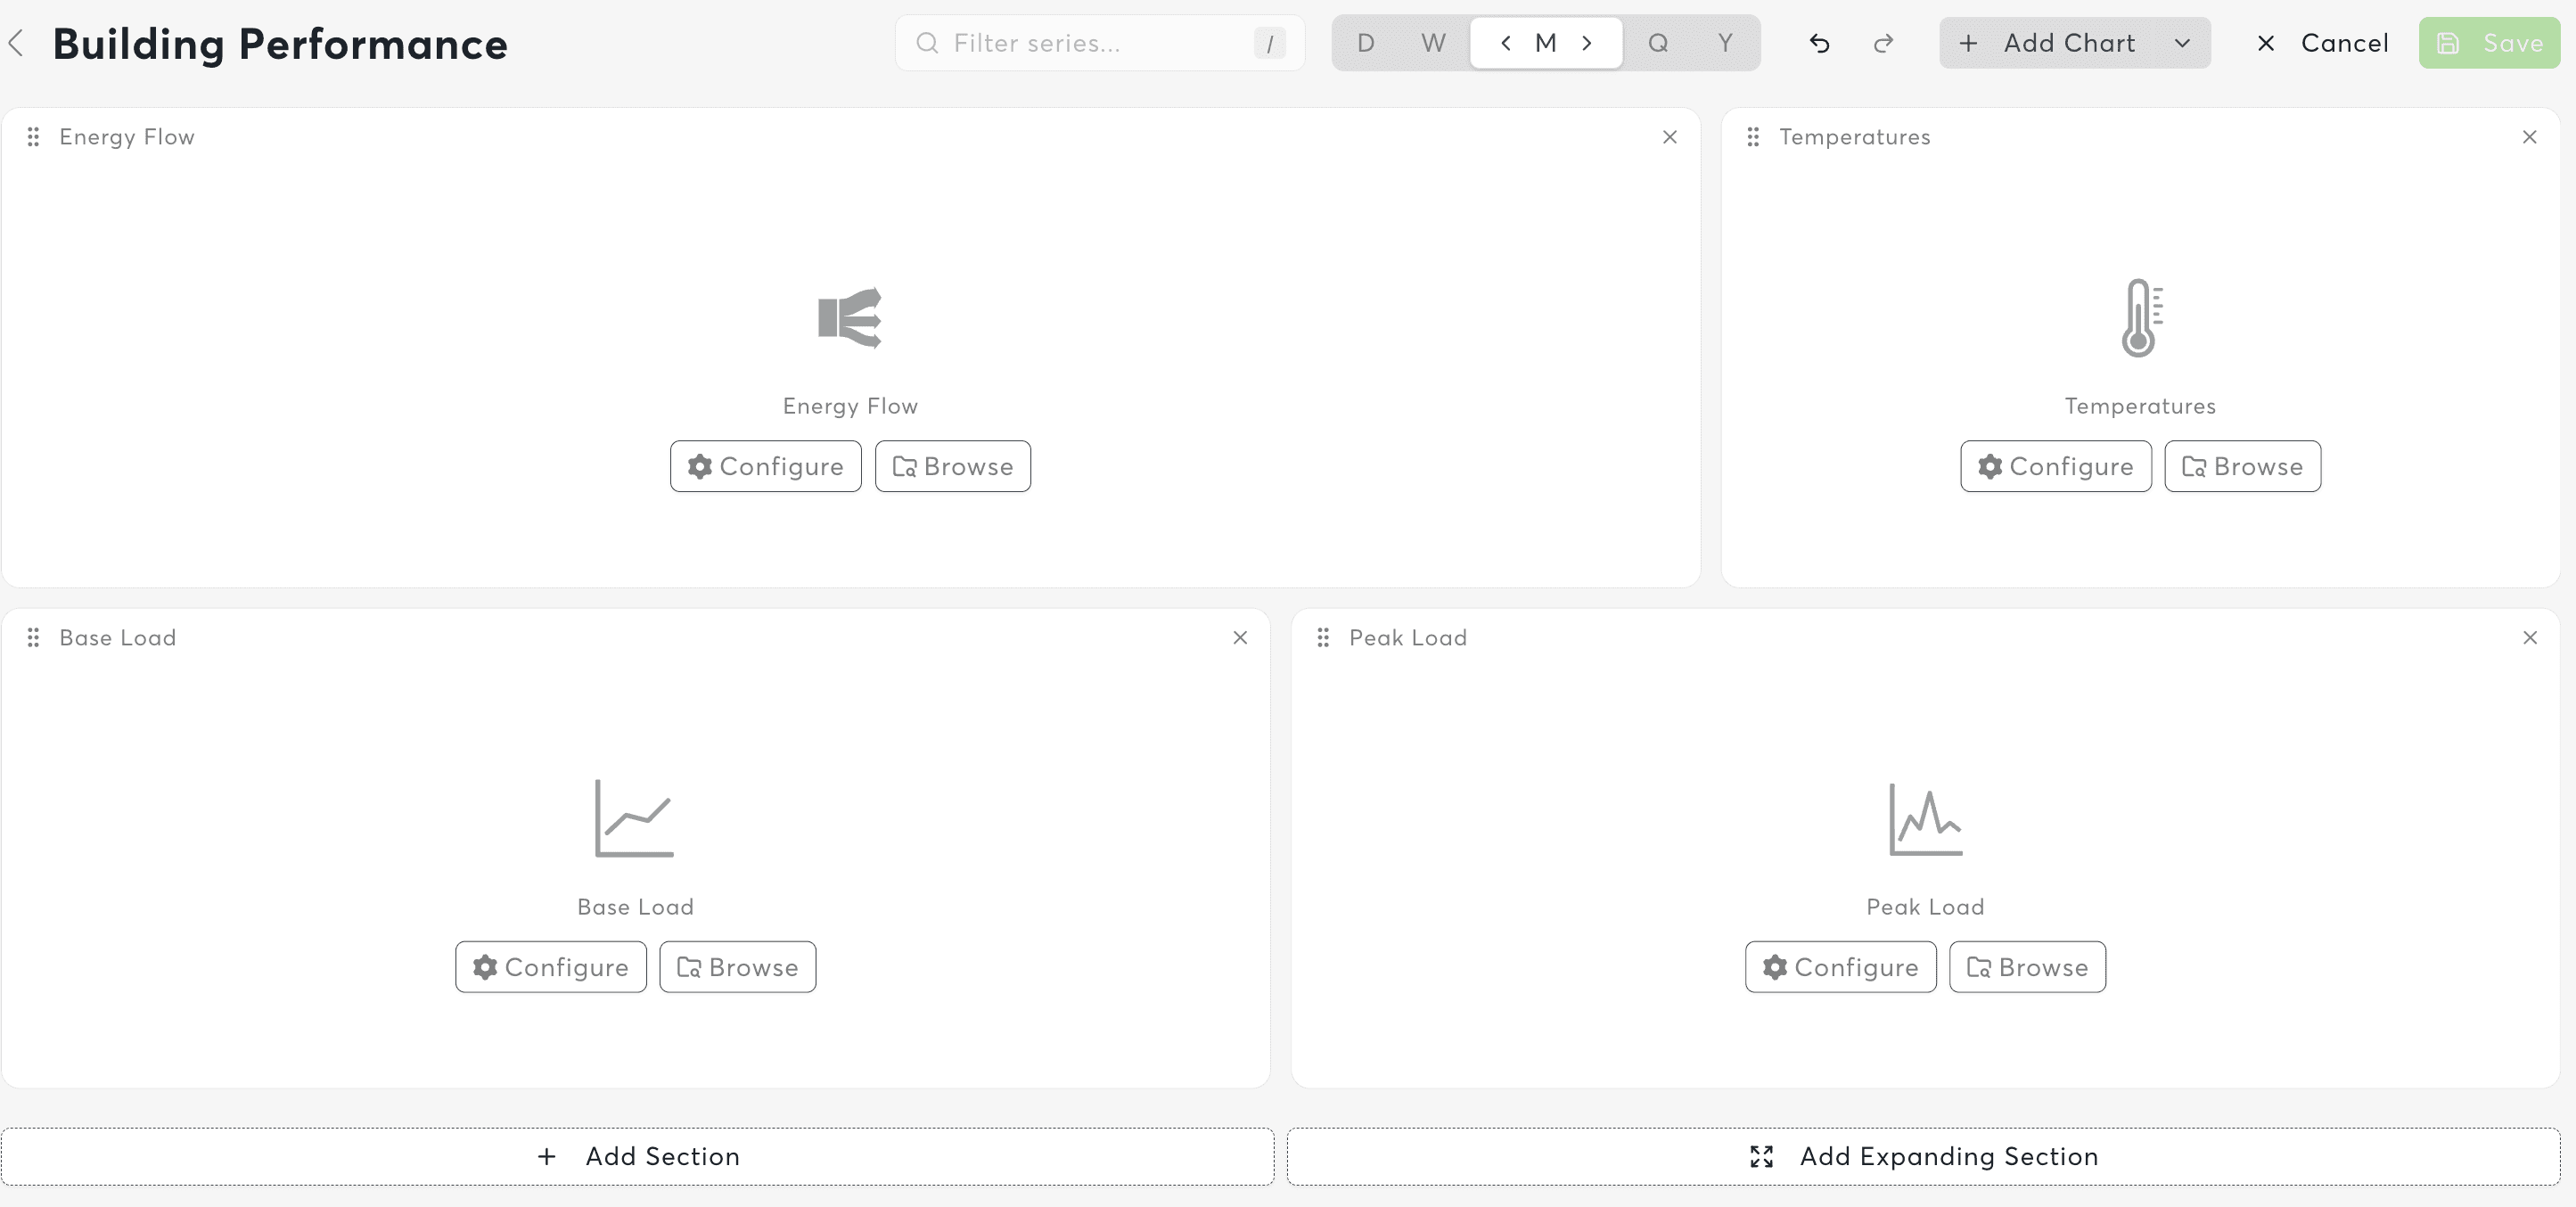
In edit mode, you can:
- Add, remove, and rearrange panels
- Create and manage sections
- Configure panel settings
- Resize panels by dragging edges
- Reposition panels by dragging
Undo/Redo
All changes can be undone or redone:
- Use the Undo/Redo buttons in the toolbar
- Up to 100 changes are tracked
Saving Changes
- Click Save to commit your changes
- Click Cancel or press
Escapeto discard changes - Unsaved changes warning appears if you try to navigate away
Changes are not saved automatically. Always click Save before leaving the dashboard editor.
Layout Management
Grid System
Dashboards use a responsive grid layout:
| Breakpoint | Screen Width | Columns |
|---|---|---|
| lg | 1200px+ | 24 columns |
| md | 996-1199px | 18 columns |
| sm | 768-995px | 12 columns |
| xs | 480-767px | 6 columns |
| xxs | <480px | 3 columns |
Panel Sizing
- Row height: 40 pixels
- Margins: 12 pixels between panels
- Minimum size: 3 columns wide, 2 rows tall
- Drag edges/corners to resize panels
Panel Positioning
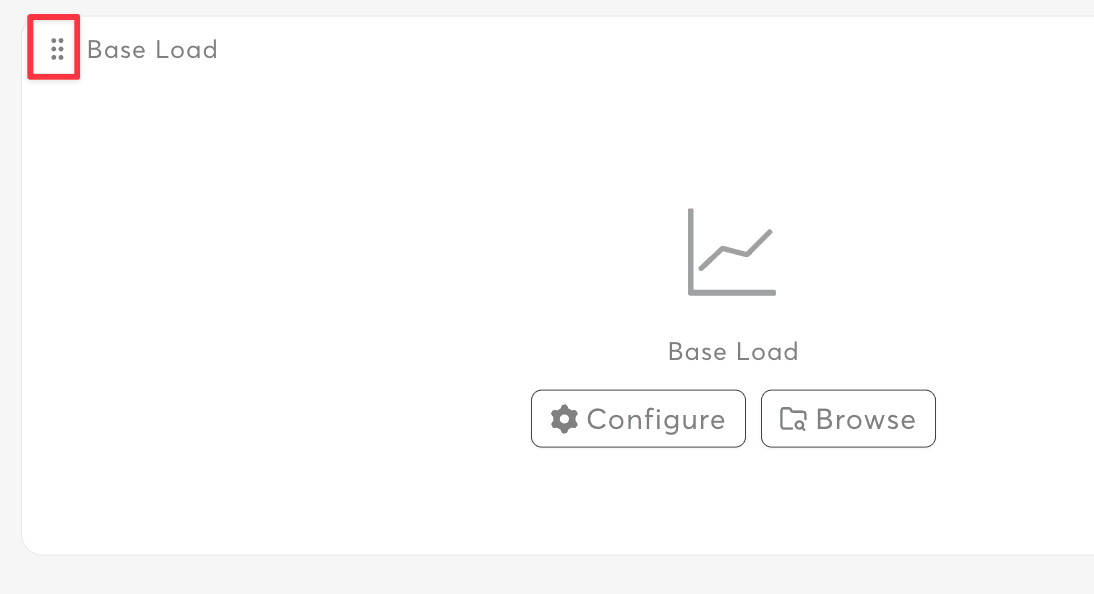
- Drag handle: Grip icon in panel header (edit mode)
- Auto-compact: Panels automatically move up to fill vertical gaps
- Collision detection: Panels cannot overlap
Adding Panels
Add Panel Button
In edit mode, use the Add Panel split button:
| Option | Result |
|---|---|
| Add Panel | New panel in ungrouped area |
| Add Section | New collapsible section |
| Add Dynamic Section | New dynamic section from chart |
| Add to [Section Name] | New panel in specific section |
Configuring New Panels
After adding a panel:
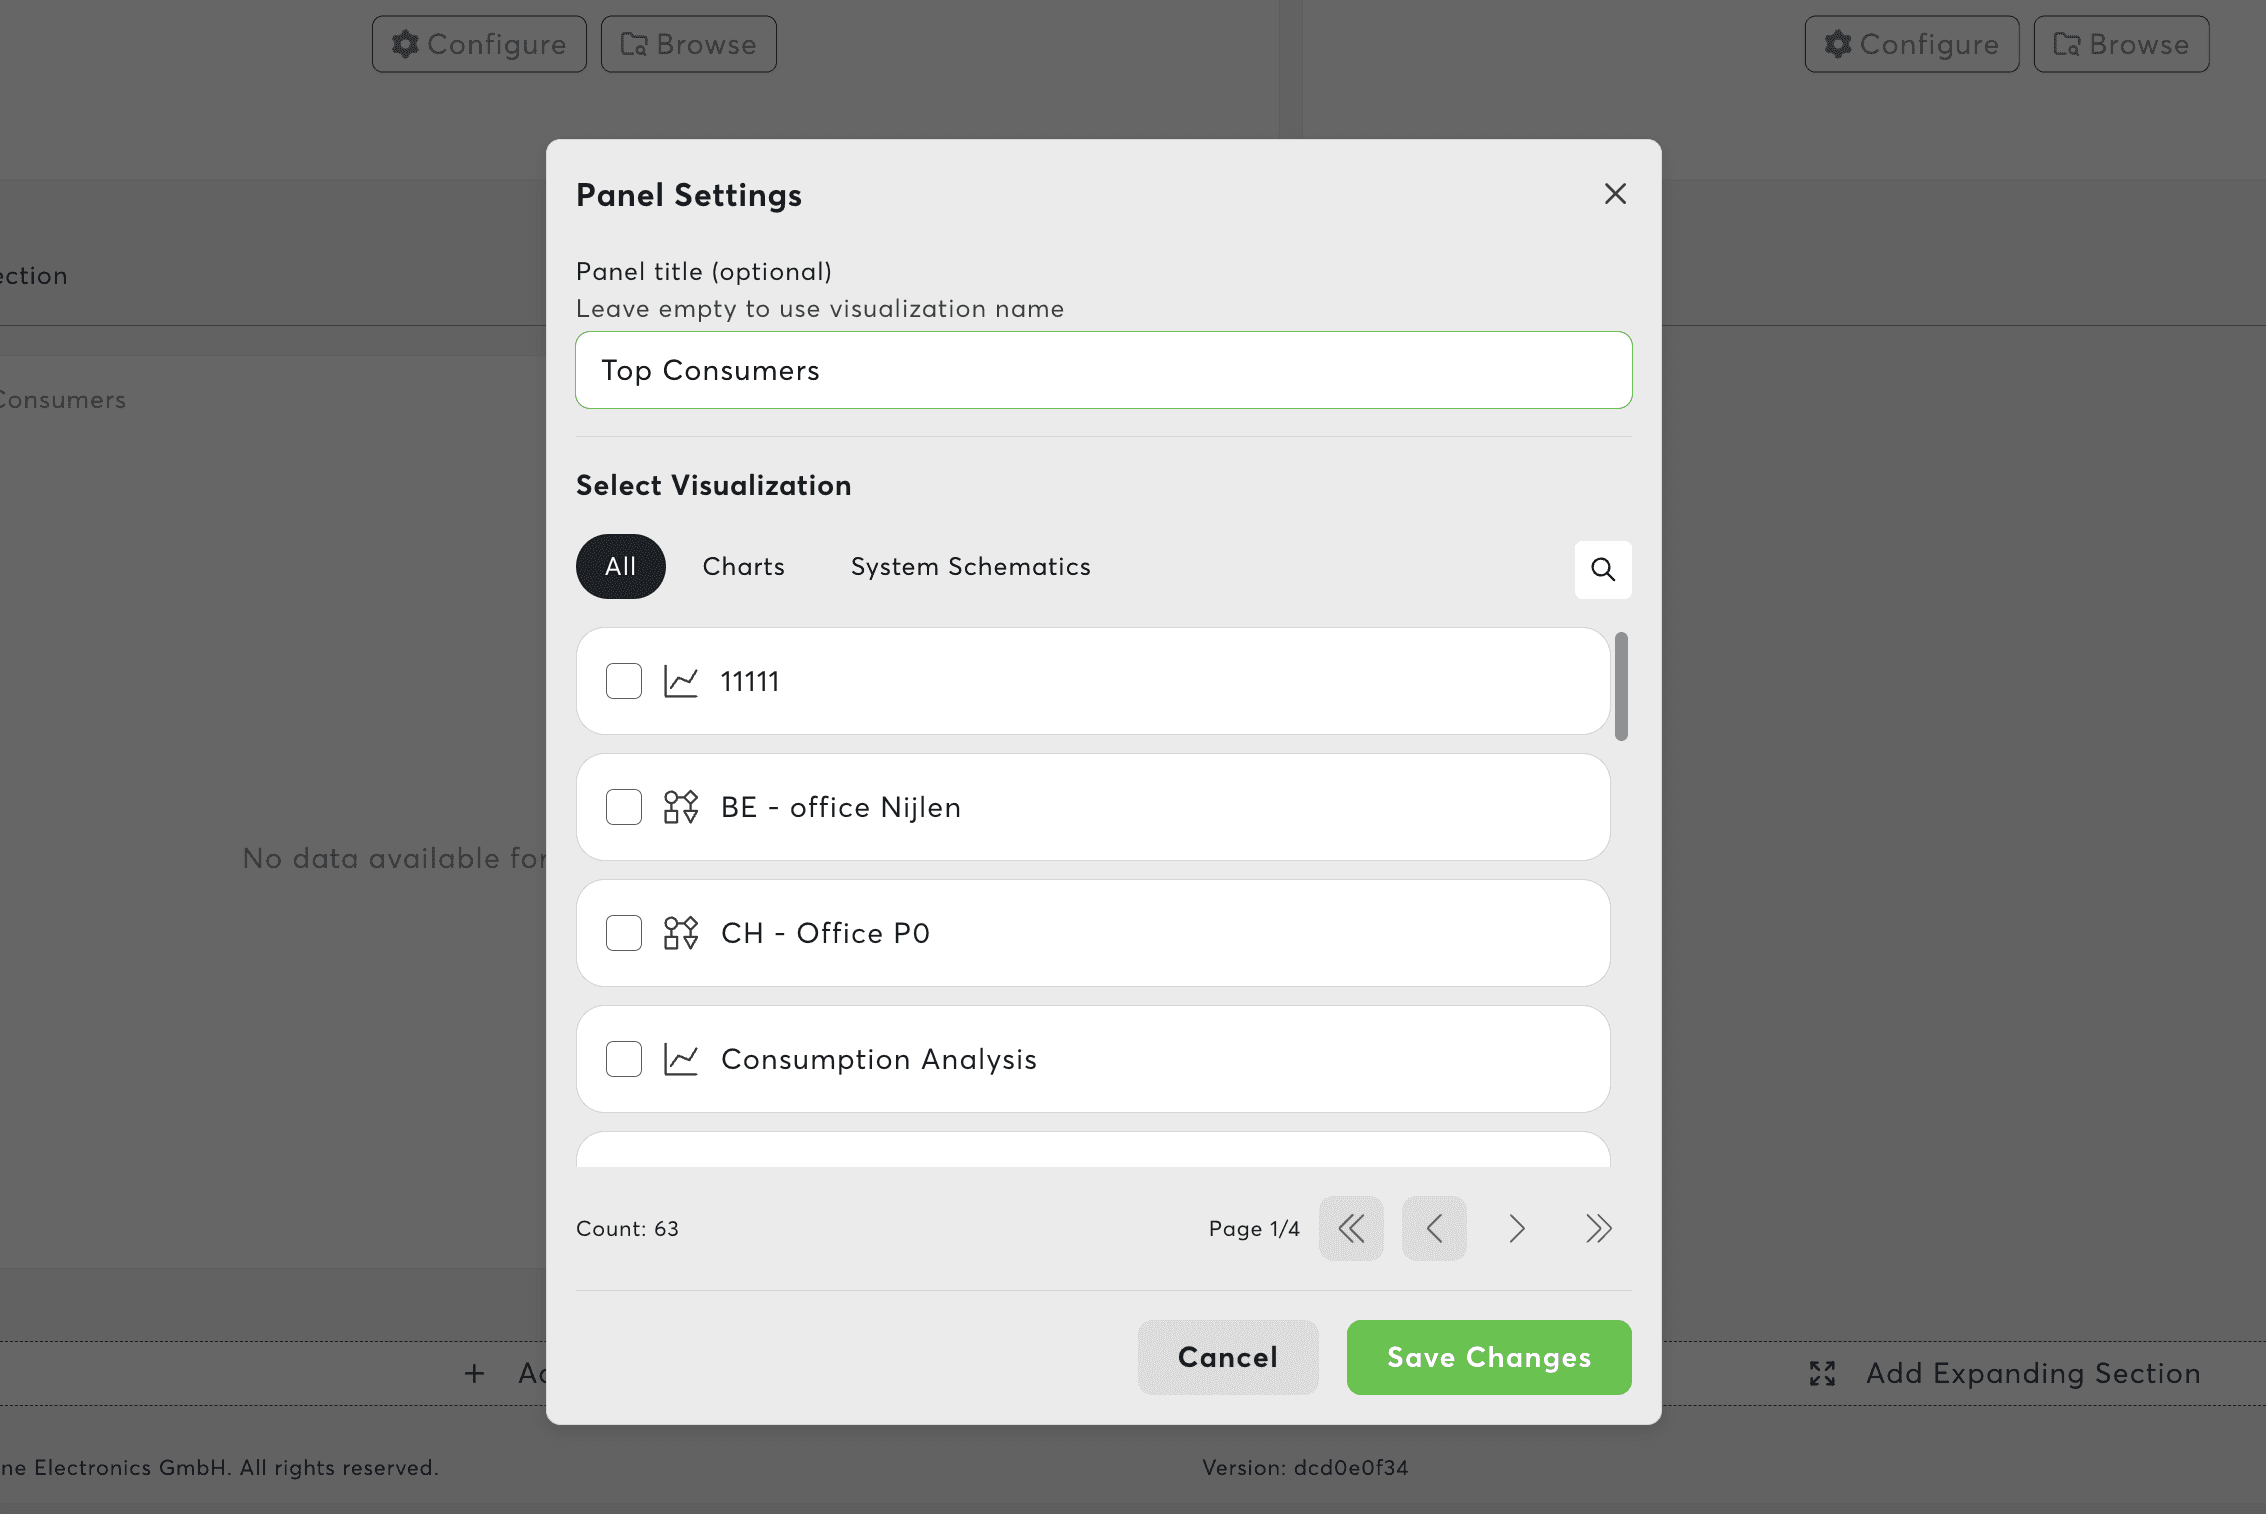
- Click "Select Chart" or the panel configuration button
- Search for an existing chart or schematic
- Click to select the visualization
- Panel automatically displays the selected content
Template Panel Configuration
When using dashboard templates, panels start unconfigured:
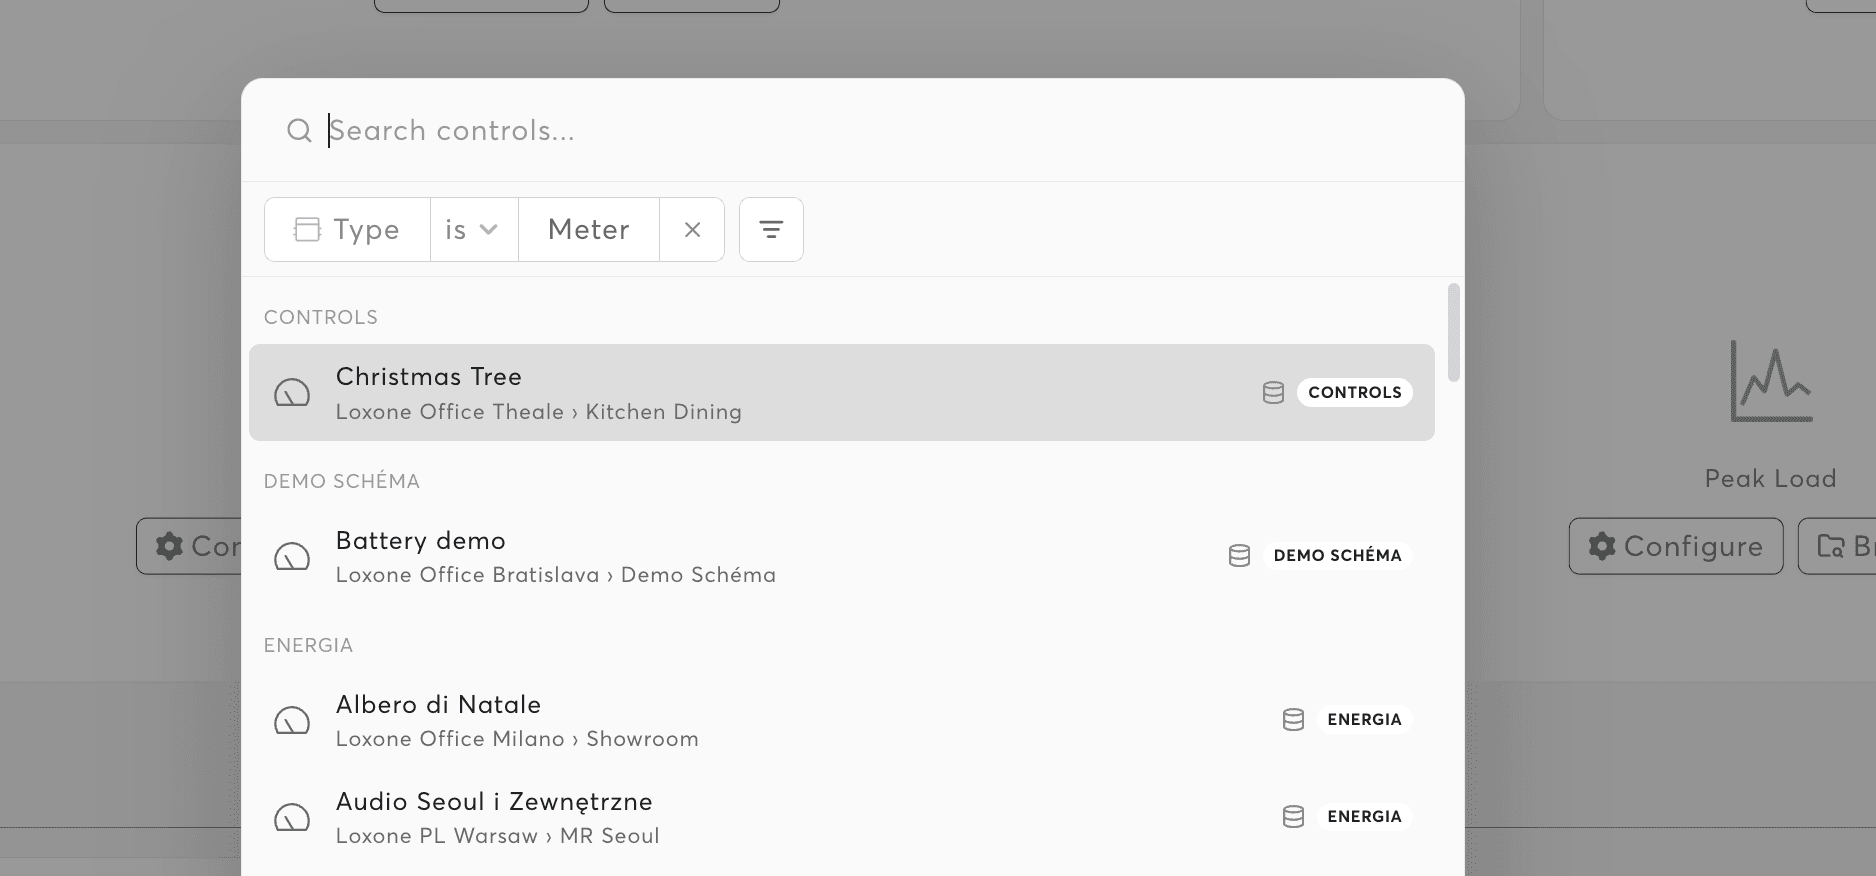
- Click the Configure button on the template panel
- The sensor search palette opens
- Select the sensors for this panel
- The underlying chart is automatically created
Panel Settings
Panel Editor Modal
Click the settings icon on any panel to open the editor:
| Setting | Description |
|---|---|
| Title | Custom title (overrides chart name) |
| Visualization | Change the linked chart or schematic |
| Time Settings | Panel-specific bucket and resolution |
Changing Visualization
- Open panel settings
- Click Change Visualization
- Search and filter available charts/schematics
- Filter by type: All, Charts, or Schematics
- Click to select new visualization
Panel-Level Time Settings
Override dashboard time settings per panel:
- Bucket: Different time window than dashboard
- Resolution: Different data granularity
- Useful for showing daily consumption next to weekly trends
Time Range Controls
Dashboard-Wide Time Range
The dashboard toolbar includes time controls that apply to all panels:
| Control | Function |
|---|---|
| Bucket Selector | Day, Week, Month, Quarter, Year |
| Previous/Next | Navigate time periods |
| Resolution Zoom | In/Out for more/less detail |

URL-Based State
Time settings are stored in the URL for shareability:
start/end– Date rangebucket– Time bucketresolution– Data resolution
Share the URL to send someone to the same view.
Keyboard Shortcuts
| Shortcut | Action |
|---|---|
← / → | Navigate previous/next period |
T | Reset to today/current period |
Series Selection
Dashboard-Wide Series Filter
Filter which sensors are displayed across all panels:
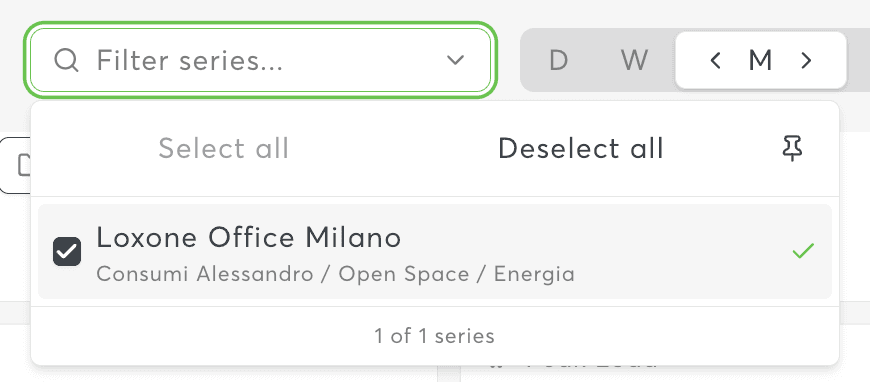
- Click the Series Filter dropdown in the toolbar
- Multi-select from all sensors across all panels
- Selection applies to all chart panels and dynamic sections
- Filter is stored in URL for sharing
Filter Behavior
| State | Behavior |
|---|---|
| No selection | Shows all sensors (default) |
| Empty selection | User explicitly deselected all |
| Specific sensors | Only selected sensors display |
Text Search Filter
Type to search sensors by name:
- Case-insensitive substring matching
- Filters the series selector dropdown
- Shows "No matching series" when no results
Auto-Refresh
Enabling Auto-Refresh
- Click the Refresh Options button in the toolbar
- Select a refresh interval
- Countdown timer shows time until next refresh
Available Intervals
- 5 seconds (for real-time monitoring)
- 30 seconds
- 1, 5, 10, 30 minutes
- 1 hour
Behavior
- Refreshes all chart and schematic panels
- Manual refresh button always available
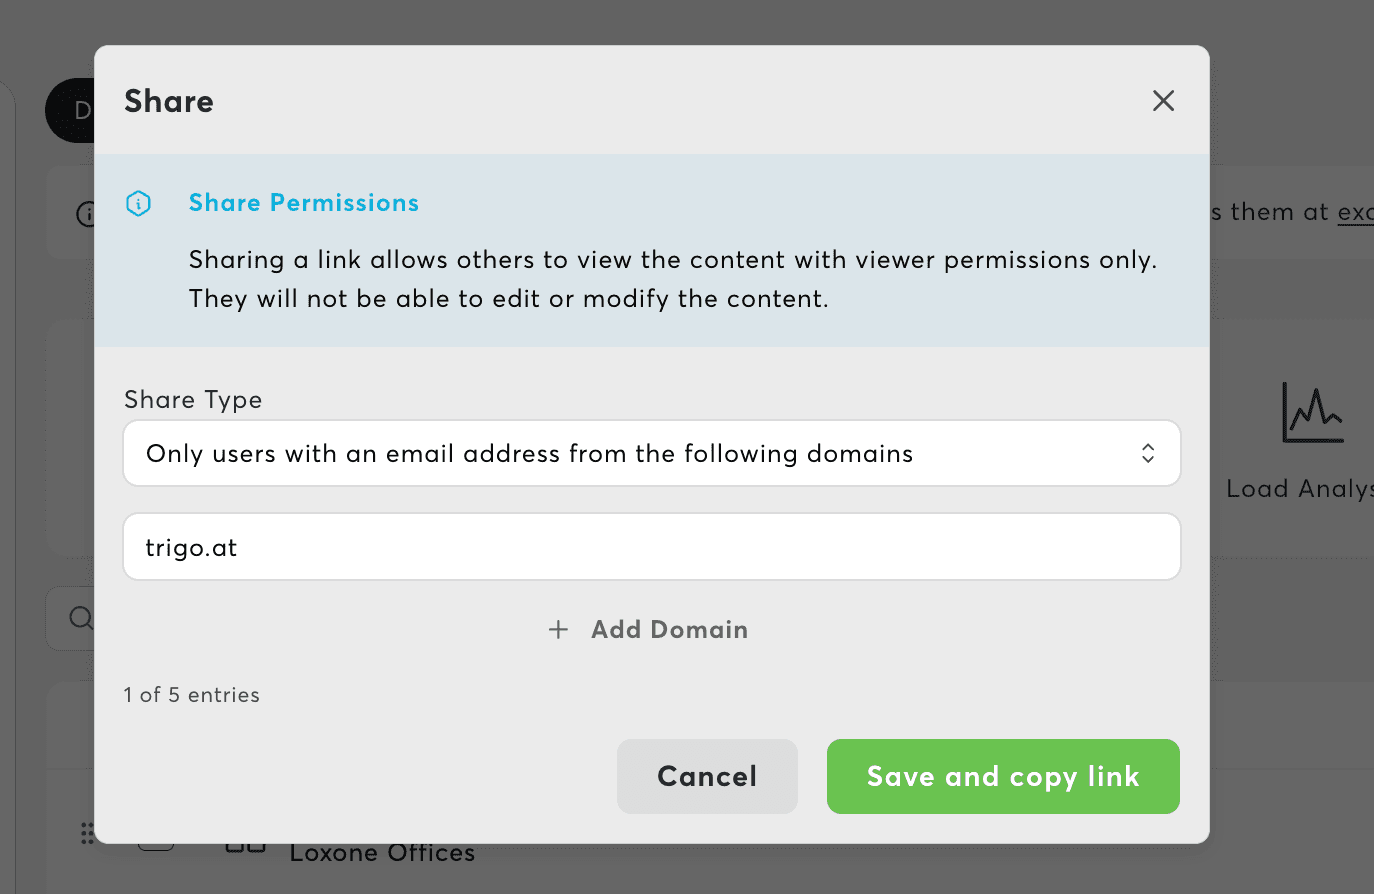
Sharing Dashboards
Enterprise Feature
Dashboard sharing requires an Enterprise workspace license. Learn about license plans →
Share Options
Enterprise workspaces can share dashboards externally:
- Click the Share button in the dashboard toolbar
- Choose a sharing mode:
| Mode | Access Level |
|---|---|
| Anyone with the link | Anonymous access (no login) |
| Specific email domains | Users from up to 5 domains |
| Specific users | Named email addresses (up to 25) |
Share Link
- Auto-generated shareable URL
- Includes share token for authentication
- Copy button for easy sharing
Shared View Permissions
- Shared users see view-only dashboards
- No Configure button appears
- Schematic panels work with share tokens
Dashboard Organization
List View
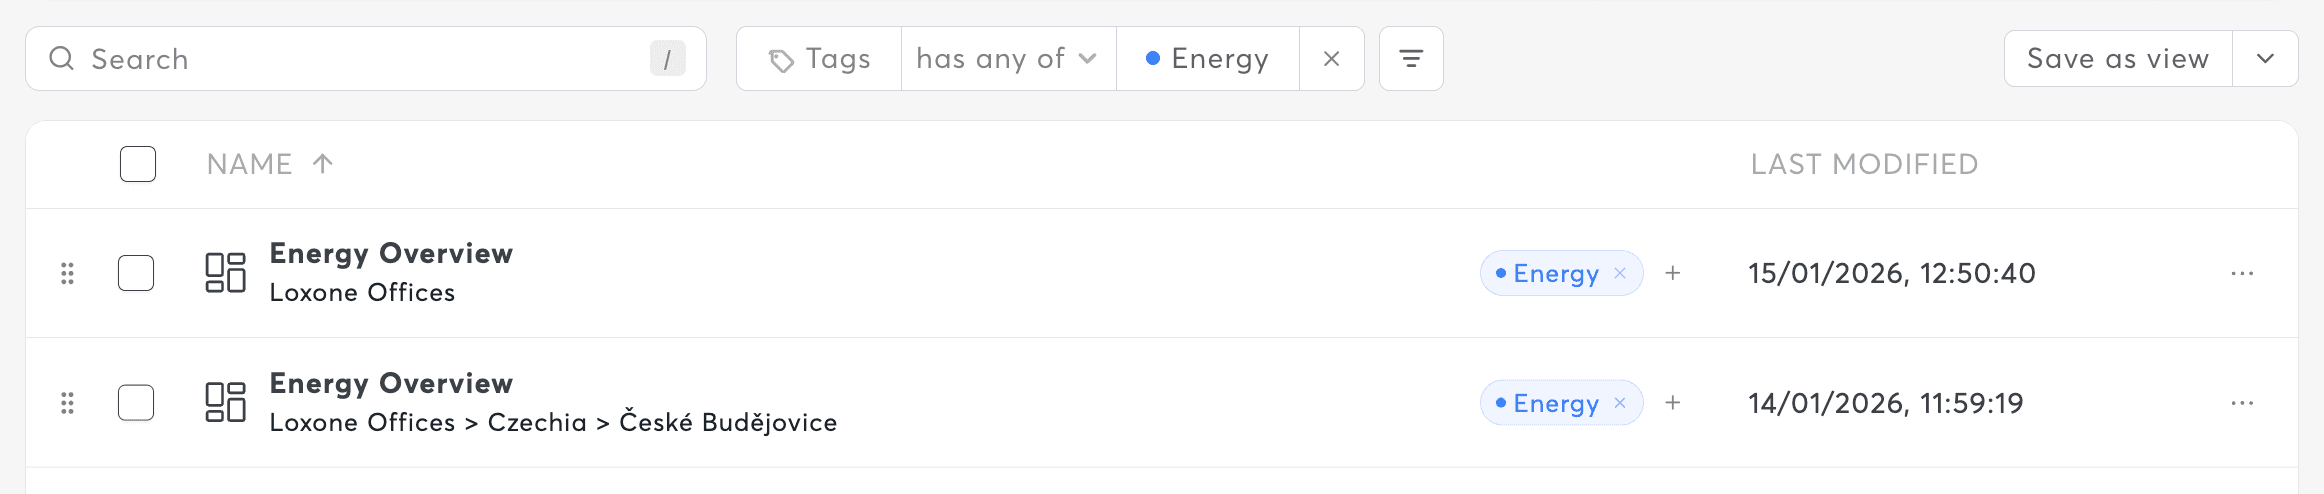
The dashboard list provides:
| Column | Description |
|---|---|
| Name | Dashboard title with tags and element breadcrumb |
| Last Modified | When dashboard was last updated |
| Actions | Edit, Rename, Duplicate, Share, Delete |
Sorting and Filtering
- Sort by: Name or Last Modified (ascending/descending)
- Search: Text search by dashboard name
- Tag Filtering: Filter by tags with AND/OR operators
- Element Filtering: Filter by structure panel selection
Saved Views
Save frequently used filter combinations:
- Apply desired filters
- Click Save View
- Name your view
- Switch between saved views using the view buttons
Bulk Actions
Select multiple dashboards for bulk operations:
| Action | Description |
|---|---|
| Bulk Delete | Delete multiple dashboards at once |
| Bulk Add Tags | Apply tags to multiple dashboards |
Only dashboards you have edit permission for can be selected for bulk actions.
Advanced Features
Set as Home
Make a dashboard your workspace homepage:
- Open the dashboard
- Click Set as Home in the toolbar
- Dashboard loads automatically when accessing the workspace
Fullscreen Mode
Toggle fullscreen viewing for presentations:
- Click the Fullscreen button in toolbar
- Hides navigation for focused viewing
- Press
Escapeor click again to exit
Duplicate Dashboard
Create a copy of an existing dashboard:
- Open dashboard list or dashboard actions
- Click Duplicate
- Enter a name for the copy
- New dashboard is created with identical panels and layout
Recent Items
Dashboards you access are tracked for quick access:
- Recent dashboards appear in navigation
- Most recently accessed dashboards listed first
- Click to quickly return to frequently used dashboards
Keyboard Shortcuts
| Shortcut | Action |
|---|---|
Cmd/Ctrl + E | Enter edit mode |
Escape | Exit edit mode (cancels changes) |
← / → | Navigate time range |
T | Reset to today |
Best Practices
Dashboard Design
- Keep it focused – 6-12 panels maximum for readability
- Use sections – Group related panels logically
- Consistent sizing – Similar panels should be similar sizes
- Important panels first – Place key metrics at top-left
Performance
- Limit real-time panels – Too many auto-refresh panels can slow performance
- Use appropriate resolution – Higher resolution = more data = slower loading
- Consider dynamic sections – Paginate rather than displaying 100+ panels
Organization
- Use tags – Tag dashboards by location, system, or purpose
- Assign to elements – Link dashboards to structure elements
- Name descriptively – Include location and purpose in name
Troubleshooting
For common dashboard issues and solutions, see the Dashboard Troubleshooting Guide.
Quick Fixes
| Issue | Solution |
|---|---|
| Panel not loading | Check if source chart/schematic still exists |
| Layout breaks on save | Ensure panels don't overlap; try Reset Layout |
| Auto-refresh not working | Verify device is online and auto-refresh is enabled |
| Shared dashboard not accessible | Check share settings and URL validity |
Related Features
- Charts – Create charts to embed in dashboards
- Schematics – Create schematics to embed in dashboards
- Export Center – Export data and schedule automated reports
Related Documentation
- License Plans – Feature availability by license
- User Permissions – Role-based access control
- Connection Troubleshooting – Device connectivity