Live Data vs Statistical Data
Real-time streaming vs pre-aggregated historical data - what's the difference?
Overview
Exosphere supports two distinct types of data collection from your Loxone Miniserver: Live Data and Statistical Data. Know the difference to choose the right recording method.
What is Live Data?
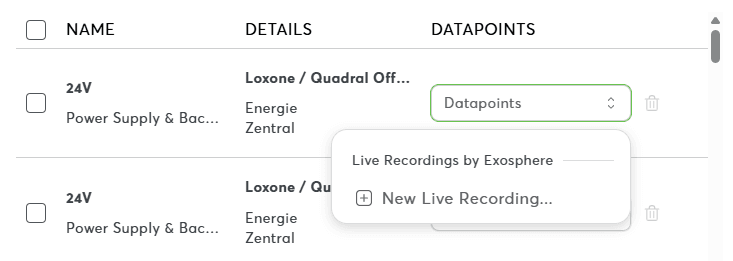
Live Data represents real-time measurements streamed directly from your Loxone Miniserver to Exosphere.
Key Features
- Real-time streaming – Data is transmitted immediately as it changes or at configured intervals
- High precision – Every measurement is captured with full accuracy
- Flexible intervals – Control how frequently data is recorded
- Default mode – All metrics use live data unless configured otherwise
What is Statistical Data?
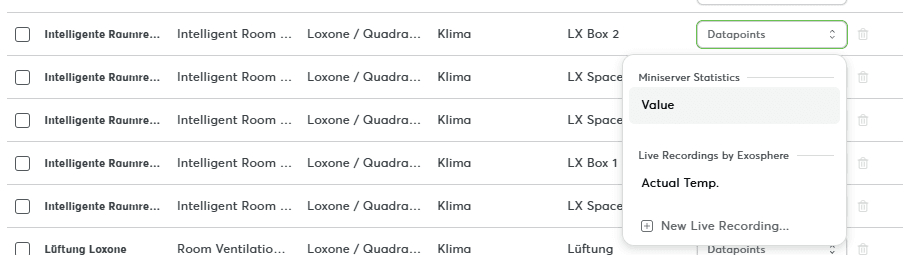
Statistical Data represents pre-aggregated historical measurements stored by your Loxone Miniserver.
Key Features
- Historical archives – Data retrieved from Miniserver's built-in statistics files
- Pre-aggregated – Contains minimum, maximum, average values per time period
- Device-managed – The Miniserver determines what statistics to keep
- Batch import – Data is imported periodically, not streamed in real-time
Configuring Live Data
Recording Settings
Configure which device states are captured and how frequently.
The recording settings interface uses the Data Selection dialog to help you find and configure controls efficiently.
Select Your Device & Control
Use filters or search to find the device and control you want to monitor
Choose Recording Interval
Available options:
- Every change – Records each time the value changes (most granular)
- Every second – Records once per second
- Every minute – Records once per minute
- Every hour – Records once per hour
- Every day – Records once per day
- Not recorded – Disables recording
Save Configuration
Apply the recording setting to start collecting data
Interval Recommendations
Choosing the Right Interval
- "Every change" works best for critical states like security sensors and alarms - Intervals (e.g., every minute) fit gradually changing values like temperature - Longer intervals (e.g., every hour) reduce storage for slowly changing values
Viewing Live Data
Once configured, live data appears immediately in:
- Real-time dashboards – See current values update live
- Time-series charts – Visualize historical trends
- Alerts and notifications – Trigger based on threshold violations
Managing Live Data Recordings
The "Exosphere Statistics" button in the Analytics section opens the Recording Settings page, where you can view all your configured Live Data recordings and delete them if needed. This is a read-only management interface - to create new Live Data recordings, use the Data Selection dialog when adding metrics to charts, schematics, or tables.
Configuring Statistical Data
Enable Statistics Collection in Loxone Config
Statistical data collection is managed through Loxone Config. See the Loxone Config documentation for more information.
Ensure Statistics Are Available
Verify that:
- Statistics files are being generated on the Miniserver
- The control supports statistics (not all controls have statistics)
- The data group is correctly configured
Select Statistics Mode
When creating or editing metrics:
- Go to Analytics → Chart/Schematic/Value History → Add Datapoint → Facet Search
- Create or edit a metric
- Select Mode: Statistics (instead of "Live")
For more information about creating charts and dashboards with your collected data, see the Charts and Dashboards documentation.
Related Documentation
- Charts – Visualize collected data with interactive charts
- Dashboards – Build monitoring dashboards
- Data Selection – How to find and select data points
- Value History – View raw measurement data in tables
- Analytics Troubleshooting – Common data issues