Data Selection (Facet Search)
Find and select datapoints from your Loxone controls with powerful filtering
Overview
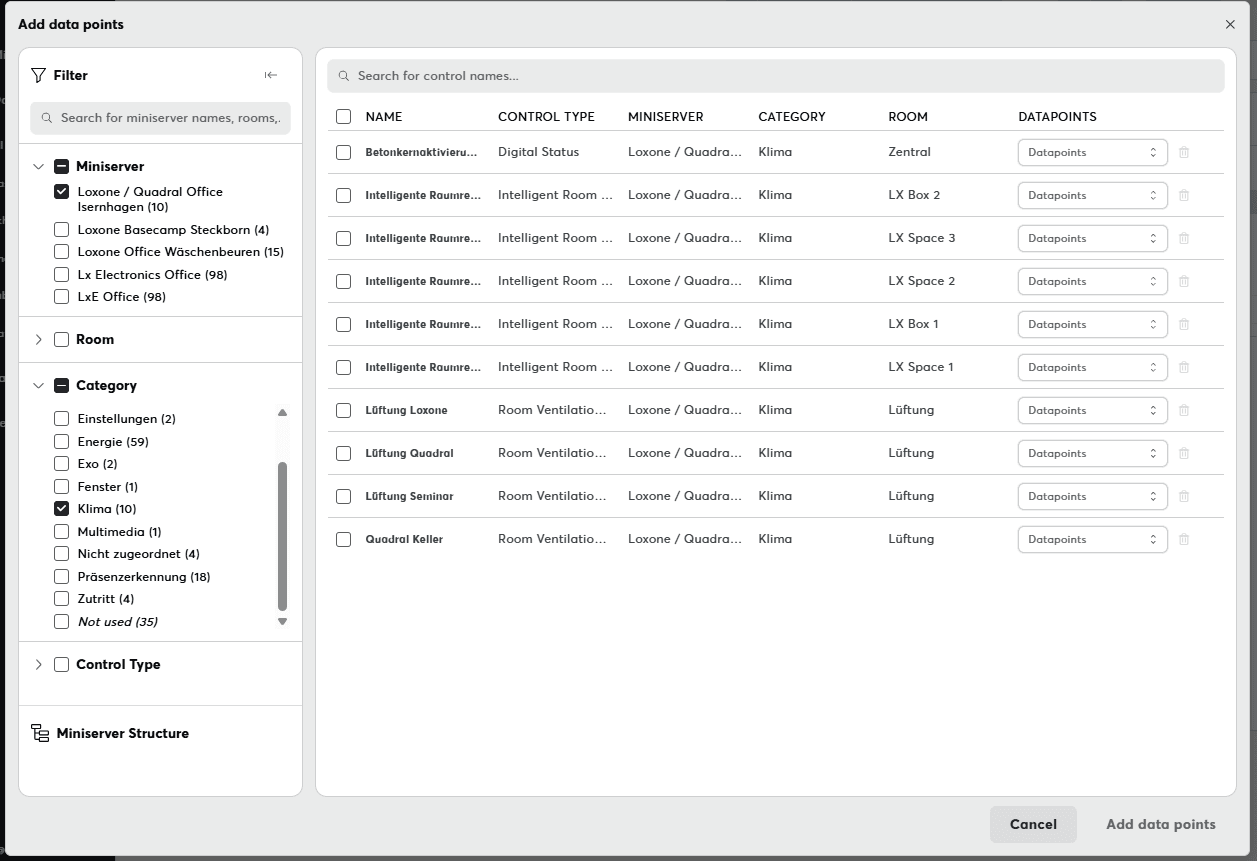
The Data Selection (Facet Search) interface lets you find and add datapoints from your Miniserver controls to charts, dashboards, tables, and reports. Filter by multiple criteria to narrow down controls.
This interface is also where you configure Live Data Recordings - setting up which control states should be continuously recorded in real-time.
Where to Find It
The data selection interface appears when you want to add datapoints in several places:
- Adding chart series - When creating or editing charts
- Adding table columns - When configuring table data sources
- Adding Schematic Controls - When creating or editing schematics
- Live recordings - When setting up new Live data recordings
Interface Structure
The data selection dialog is split into two main sections:
Left Panel: Filters
Select criteria to narrow down your search. Each filter category shows the number of available items in parentheses.
Available Filter Categories:
- Miniserver: Filter by specific Miniserver devices
- Room: Filter by room location
- Category: Filter by functional category
- Control Type: Filter by control type (e.g., Light Controller, Temperature Sensor)
Right Panel: Results & Selection
View and select matching controls and their available datapoints.
How to Use
Step 1: Apply Filters
- Choose Filter Categories: Click a category heading to expand it
- Select Filter Values:
- Check individual boxes to include specific values
- Check the category header box to select/deselect all visible items
- View Updated Results: The right panel automatically updates to show matching controls
Search by Name (Optional)
In addition to filters, you can search directly by control name:
- Type into the search box at the top right
- Search is case-insensitive
- Works in combination with active filters
- Updates results in real-time as you type
Tip
Use the search box for quick lookups when you know the control name. Use filters when exploring or working with groups of similar controls.
Step 2: Select Datapoints
Once you've found the controls you need, select the datapoints you want to add:
- Expand Control Details: Click on a control to view its available datapoints
- Choose Datapoints:
- Select individual datapoints using checkboxes
- For controls with multiple datapoints (statistics), select specific intervals or accumulated values
- Bulk Selection (Optional):
- Select multiple controls at once
- If all selected controls share the same datapoint type, you'll get bulk assignment options
- This saves time when configuring many similar controls
Step 3: Configure Recording Settings (Live Data)
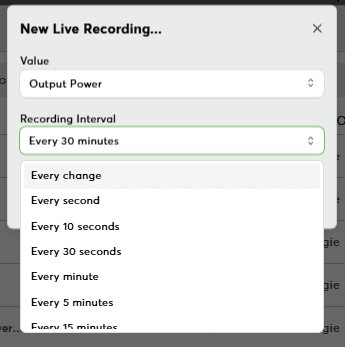
When setting up live data recordings, you'll see additional options:
- Recording Interval - Choose how frequently to capture data:
- Every change (most granular)
- Every second
- Every minute
- Every hour
- Every day
- Not recorded (disable)
Storage Consideration
Using "Every change" for high-frequency controls can generate significant storage. See Live Data vs Statistical Data for more information.
Step 4: Add Selected Items
When you're satisfied with your selection:
- Click "Add Data Points" button
- The dialog closes and your selections are applied
Related Features
- Live Data Configuration - Set up recording intervals for continuous data collection
- Chart Series - Add datapoints to time-series charts
- Table Columns - Configure table data sources
- Export Center - Export selected metrics
Related Documentation
- Live Data vs Statistical Data - Understanding data collection modes
- Charts - Creating time-series visualizations
- Connection Troubleshooting - Device connectivity requirements
- Workspace Permissions - Role-based access control